25-11-2021
News in Survey Manager
In the latest version of Survey Manager, we have focused on improving the user's ability to manage results. Surveys, indices and comparisons can now be exported to PowerPoint, enabling users to easily and nicely present the results of their surveys.
The results of a survey can now also be exported to an Excel spreadsheet. As you can now easily export the data to Excel, you have the ability to process and handle the data however you would like.

In addition, it is now possible to see submission dates for individual responses and participants. This can be seen in the list of respondents and this list can now also be sorted so that you can easily see the information that you are interested in.
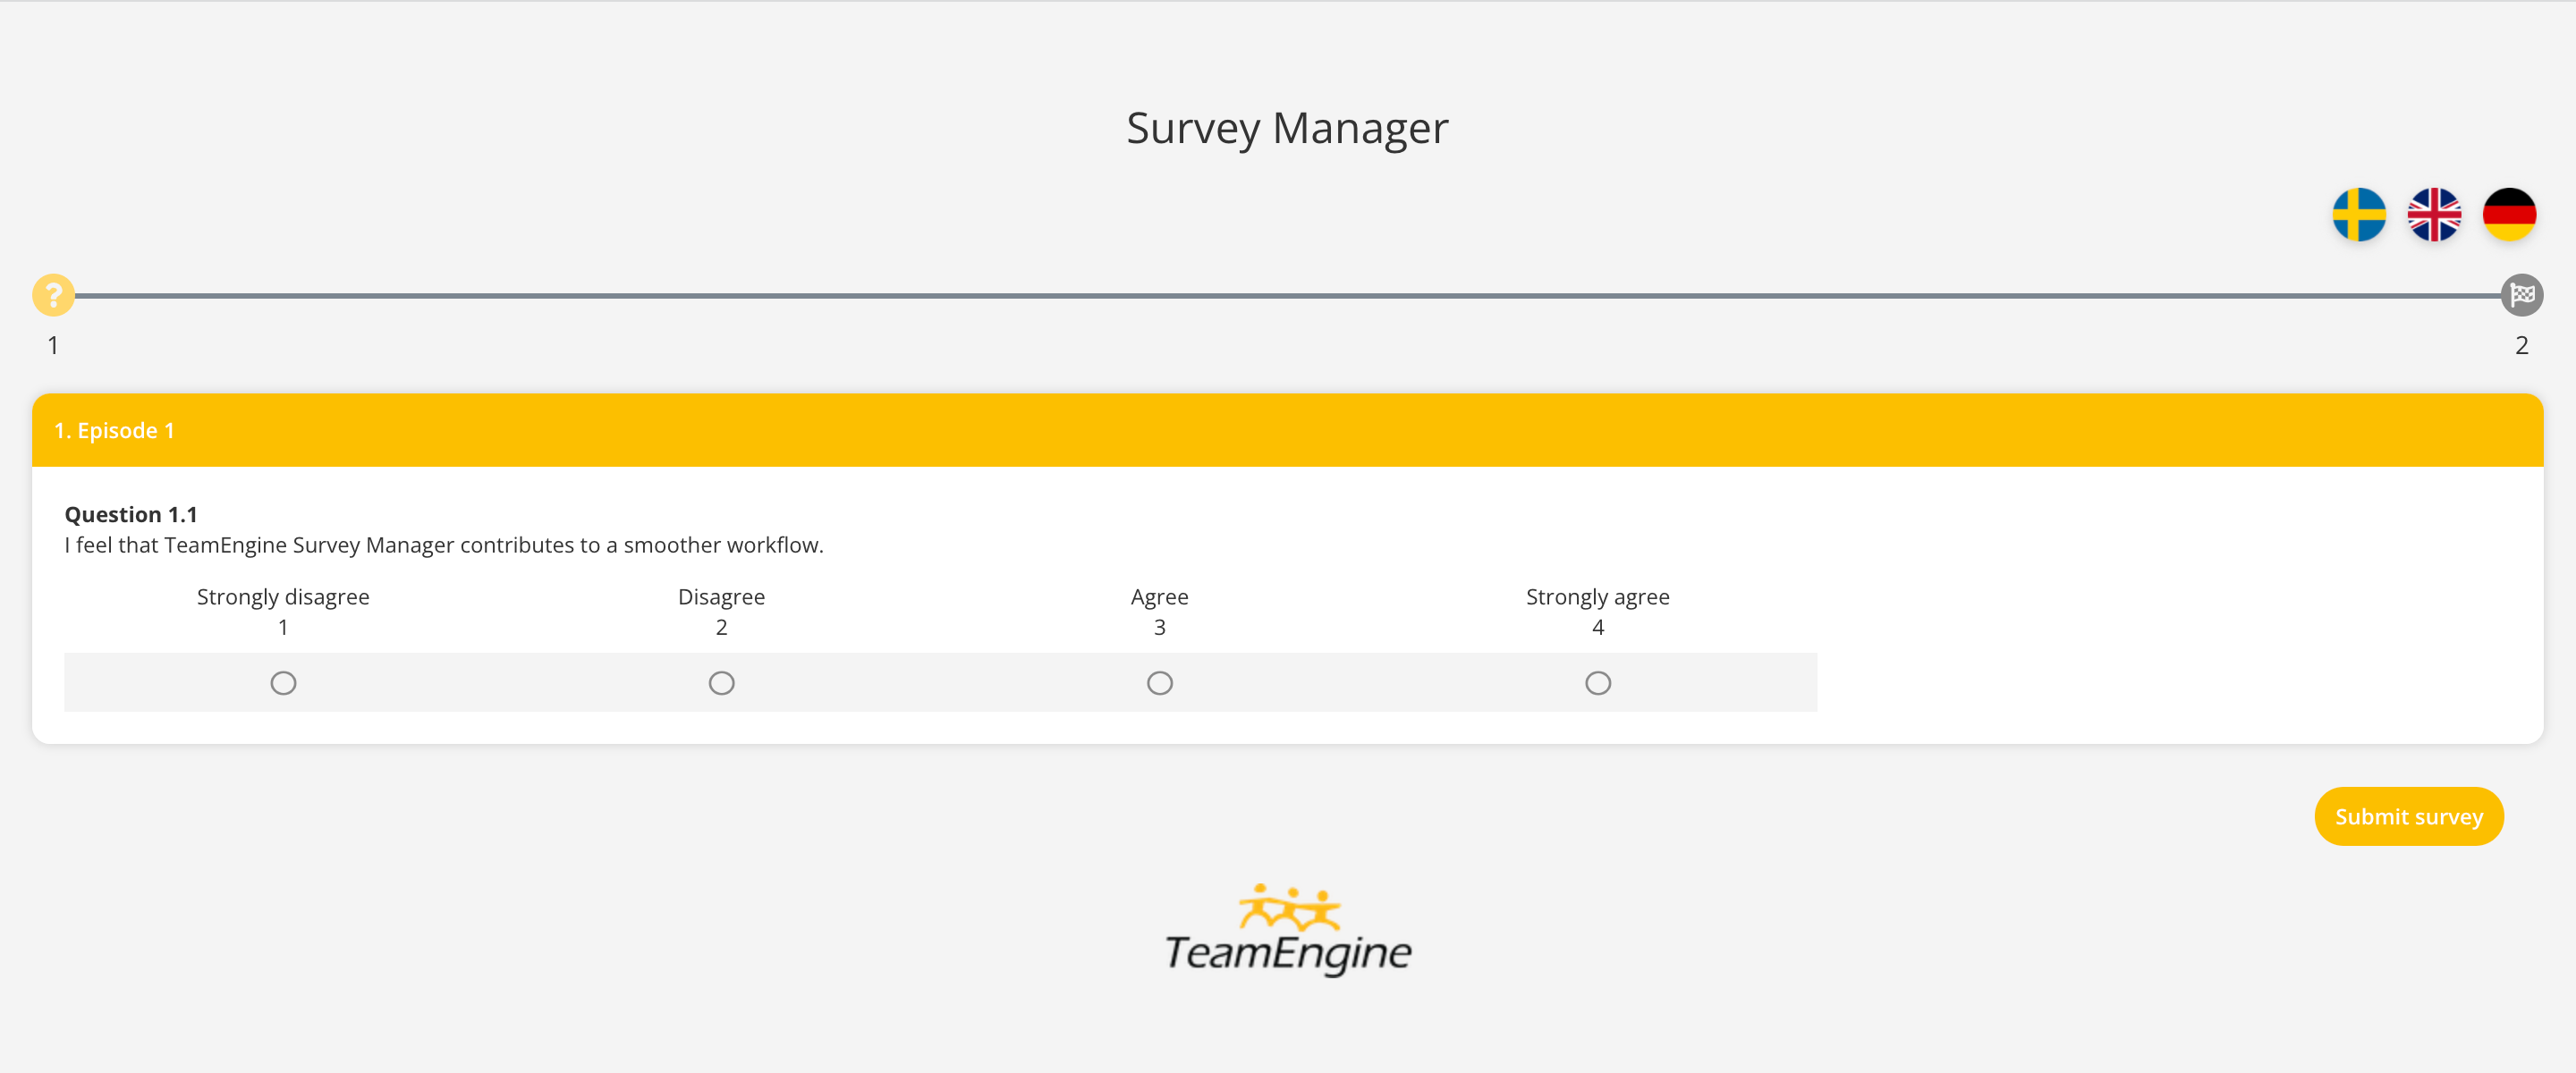
Linear scales have also seen an improvement in terms of labels. For linear scales and multiple linear scales, it is now possible to add specific labels for each value in the scale. It is entirely up to you which values should have labels. Choose whether you want the first and last ones or maybe even add a label to the value in the middle or simply enter labels for all values in the scale.
We hope you enjoy this update and that it will further simplify your work.